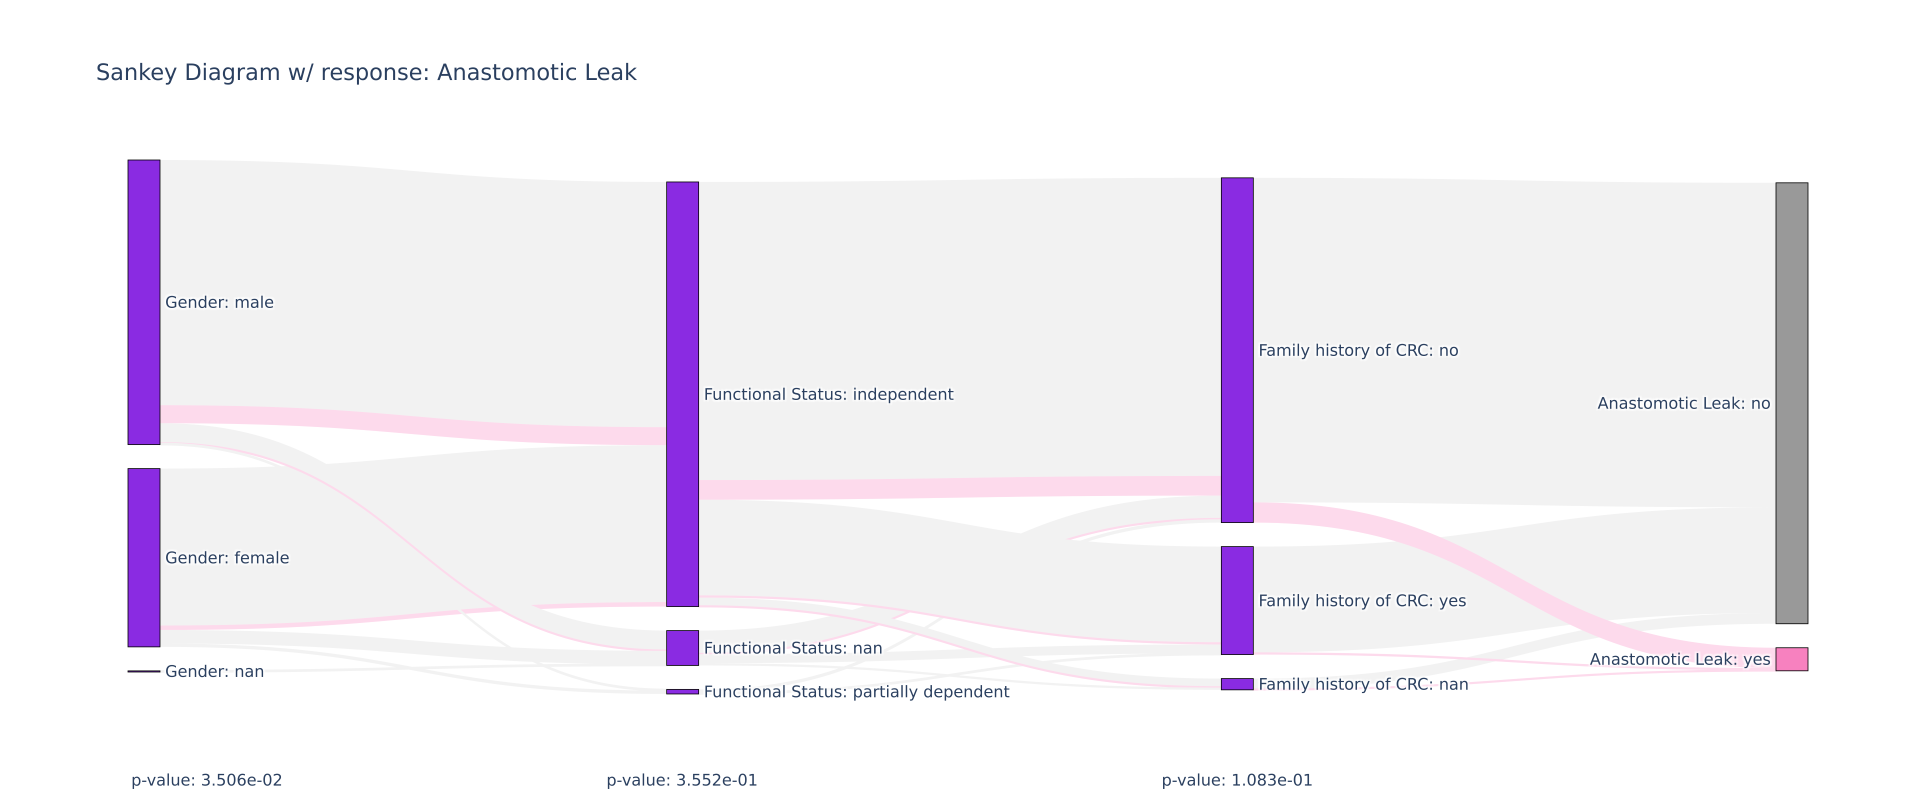
BetterSankey
The technical contribution of my capstone research project, BetterSankey is a python utility that extends the functionality of the Plot.ly implementation of Sankey diagrams to be more data-driven and integrate common data science methods (statistical significance testing, feature selection, and model-building). It was developed for the use case of rectal cancer treatment modeling in close collaboration with the Chief of Colorectal Surgery at Emory Cancer Center.

Given a dataset, a series of discrete variables, and a response variable, the utility automatically builds a Sankey diagram to visualize the relationship between these variables in just a few seconds. Optionally, users can instruct the tool to conduct statistical signifcance testing (chi-squared for independence), feature selection (for which I present a novel, chained approach to the popular Sequential Feature Selection), and model building. In cases where visualizing between-cohorts differences may provide useful information, the utility allows for the diagram to “branch” at a predetermined feature to see how different levels of the variable may impact response.
Source code for BetterSankey is distributed as part of the repository for my capstone project, which demonstrates its featureset.
